Analytics Techniques
Contents
Analytics Techniques#
Structured analytic techniques (SATs) are a set of tools used by analysts to improve the quality of their analysis and reduce the impact of cognitive biases and errors. SATs are based on the premise that humans are fallible and that our cognitive limitations can lead to errors in analysis. The goal of SATs is to provide a framework for analysis that minimizes the impact of these cognitive biases and errors.
Why SATs Matter
In the art of cybersecurity, it is not the tools in our arsenal that define our mastery, but the clarity and depth of our thought. The true power of a cyber professional lies in understanding the intricacies beyond the screen, a skill more potent than any instrument. It is through structured analysis that one hones their craft and stands distinguished in the field.
Why are SATs important in cybersecurity?#
In the field of cybersecurity, Structured Analytic Techniques (SATs) serve as a critical set of tools to enhance the quality and reliability of analysis. These techniques are designed to counteract cognitive limitations and biases.
SATs assist analysts in systematically breaking down cybersecurity problems, ensuring that assumptions, biases, and established cognitive patterns are thoroughly scrutinized. This methodical approach to analysis helps in identifying subtle patterns and anomalies in data, situations or events.
By employing structured techniques, cybersecurity analysts can rigorously evaluate their hypotheses and conclusions, providing a more transparent and robust analysis. Moreover, SATs offer a balance between intuitive and methodical problem-solving, adding rigor to the analysis and making it easier to communicate and justify conclusions to stakeholders.
In an era where cybersecurity challenges are becoming increasingly intricate, the application of SATs is vital for ensuring that the underlying analysis driving cybersecurity strategies is as sound, comprehensive, and unbiased as possible.
Examples#
Here’s a list of examples showcasing how SATs are used in cybersecurity:
Threat Modeling: Utilizing SATs to systematically identify and assess potential threats in software development and network architecture.
Incident Analysis: Applying techniques like root cause analysis to dissect security incidents and understand attack vectors. Penetration Testing Planning: Employing structured approaches to outline and prioritize testing strategies for identifying vulnerabilities.
Risk Assessment: Implementing structured frameworks to evaluate cybersecurity risks and their potential impact on organizational assets.
Compliance Auditing: Using structured checklists and matrices to ensure adherence to cybersecurity policies and regulatory requirements.
Policy Development: Structured techniques aid in the systematic development and revision of cybersecurity policies and standards.
Vendor Risk Management: Applying structured approaches to assess and manage the cybersecurity risks associated with third-party vendors.
Incident Reporting: Structuring incident reports in a manner that clearly communicates the timeline, impact, and response to security incidents.
Threat Intelligence Reports: Organizing and presenting threat intelligence in a structured format for better understanding and decision-making.
Incident Management: Utilizing decision trees and flowcharts to structure the incident response process and forensic investigations.
Vulnerability Management: Applying prioritization matrices to assess and rank vulnerabilities based on their severity, impact, and exploitability.
SATs are widely used in cybersecurity, often without explicit awareness. Learning these techniques formally is a game changer for cyber professionals. It transforms intuitive problem-solving into a structured approach, vastly improving the analysis, interpretation, and response to complex cyber threats.
How you should choose a technique?#
Choosing the right technique in structured analytics is crucial to the success of any analysis. This decision can significantly influence the accuracy, relevance, and impact of your findings. Here are key factors to consider when selecting an analytical technique:
Understand the Objective: Begin by clearly defining the goal of your analysis. Are you trying to identify trends, predict future events, understand complex relationships, or solve a specific problem? The objective will guide you in choosing the most appropriate technique.
Know Your Audience: Tailor your technique to the needs and comprehension level of your audience. If your findings will be presented to non-technical stakeholders, choose methods that can be easily explained and visualized.
Evaluate Resources and Constraints: Be realistic about the resources available, including time, expertise, and computational power. Some techniques might require more advanced skills or computing resources than others.
Check for Relevance and Applicability: Ensure the technique aligns with the current industry standards and best practices. It should also be relevant to the specific field or sector of your analysis.
Flexibility and Scalability: Consider how adaptable the technique is to changes and how well it can scale with increased data or evolving requirements.
Iterative Testing and Validation: Finally, remember that selecting a technique is not always a one-time decision. Be prepared to iteratively test different methods and validate their effectiveness in addressing your analysis objectives.
Decompose and Visualize#
The “Decompose and Visualize” approach in Structured Analytics Techniques is a method used for making sense of complex data. It involves breaking down large data sets into smaller parts to make them easier to understand. Once the data is broken down, it is then presented visually using charts, graphs, or maps. This makes it easier to see patterns and trends that might not be obvious in the raw data. In short, this technique helps in understanding complex data more clearly and making better decisions based on that data.
AIMS (Audience, Issue, Message and Storyline)#
The goal of the AIMS framework is to create a structured approach to presenting data that is audience-centric, issue-focused, message-driven, and story-oriented. By following this framework, analysts can ensure that their data presentations are not only informative but also compelling and impactful.

Audience: The first step is to identify and understand the audience. This involves considering who will be receiving the information and tailoring the analysis to their needs and comprehension level. Knowing the audience helps in determining the complexity of the data, the type of visualizations to use, and the depth of analysis required.
Who is my audience? (e.g., executives, technical experts, general public)
What are their needs and expectations from this analysis?
How familiar are they with the subject matter and technical jargon?
What is the best way to present the data to this audience (visuals, text, level of detail)?
How can I make the data meaningful and engaging for them?
Issue: Clearly defining the issue at hand is critical. This involves outlining the specific problem or question that the analysis aims to address. A precise issue guides the entire analytical process, ensuring that the data collected and the analysis performed are relevant and focused.
What specific problem or question am I addressing with this analysis?
Is the issue clearly defined and understood?
How does this issue relate to the interests and needs of the audience?
Have I narrowed down the issue enough to be focused but still meaningful?
What data is relevant to this issue, and what can be excluded?
Message: The message is the central insight or conclusion drawn from the data. It should be concise and directly related to the issue. The message is what you want the audience to understand and remember, so it needs to be clearly articulated and emphasized in the presentation.
What is the key insight or conclusion I want to communicate?
Is my message directly addressing the issue?
How can I articulate this message clearly and succinctly?
Will the audience understand and remember this message?
How does this message drive the desired action or decision-making?
Storyline: Developing a storyline involves connecting the data points into a coherent narrative. This narrative should logically flow from the introduction of the issue, through the data analysis, to the concluding message. A well-crafted storyline helps in making the data more relatable and engaging, ensuring that the audience can easily follow and understand the significance of the analysis.
How can I connect the data points to tell a compelling story?
Does the storyline flow logically from the introduction of the issue to the conclusion?
How can I make the storyline engaging and relatable for the audience?
Are there any gaps or jumps in logic in my storyline?
Does the storyline reinforce and support the key message?
Issue Redefinition#
The goal of Issue Redefinition in structured analytics is to explore various reinterpretations of the central issue to understand how these alterations can impact the direction of research.

Here is a proposed methodology to effectively experiment with different ways of redefining the issue:
Initial Question: Start with the original issue or question as it is currently defined. This serves as the baseline for comparison.
Have I clearly stated the original issue?
Is the original issue based on specific data or assumptions?
Rephrase: Alter the wording of the issue without changing its fundamental meaning. This can involve using synonyms, changing the sentence structure, or presenting the issue from a different angle. The goal here is to see if a different phrasing offers a new perspective or understanding.
Have I tried rephrasing the issue in different ways?
Does each rephrased version offer a new perspective?
Ask Why: Delve into the reasons behind the issue. Asking “Why?” repeatedly helps uncover the root cause or deeper aspects of the problem. This can lead to a more profound understanding of the issue’s underlying factors.
Have I asked ‘Why’ repeatedly to uncover deeper layers of the issue?
Are the underlying causes of the issue now more evident?
Broaden the Issue: Expand the scope of the issue. Consider related areas, wider impacts, or longer-term implications. By broadening the issue, you might identify new areas of interest or recognize broader patterns and trends.
Have I considered broader implications and related areas?
Does a broader view reveal additional factors or consequences?
Narrow the Focus: Conversely, make the issue more specific. Focus on a particular aspect, demographic, timeframe, or context. Narrowing down can reveal more detailed insights and offer a more concentrated area for in-depth analysis.
Have I identified specific aspects of the issue to focus on?
Does narrowing the focus bring more detailed insights?
Opposite Perspective: Challenge the issue by looking at it from an entirely opposite perspective. This could involve considering the contrary of the current issue or questioning the fundamental assumptions that the issue is based on. This radical approach can sometimes uncover innovative viewpoints or alternative hypotheses.
Have I looked at the issue from an opposite or contrary viewpoint?
Does this viewpoint challenge existing assumptions or reveal new possibilities?
Four Ways of Seeing#
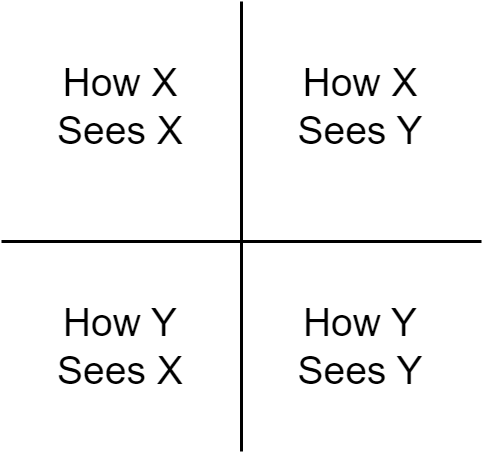
“Four Ways of Seeing” is an analytical tool that enhances the understanding of multiple stakeholders’ perceptions, motivations, and potential misunderstandings in a given scenario. This method is particularly valuable in situations involving multiple parties, providing insights into their interrelationships and viewpoints.
Application#
Identification of Stakeholders: Initially, identify the key stakeholders involved in the scenario. Label them for ease of analysis (e.g., Stakeholder X and Stakeholder Y).
Creating the Matrix: Construct a 2-by-2 matrix. Label the matrix with the stakeholders’ names to represent how each stakeholder views themselves (X sees X, Y sees Y) and how they view each other (X sees Y, Y sees X).
Gathering and Analyzing Perspectives: For each cell in the matrix, gather inputs using methods like brainstorming. Analyze how each stakeholder perceives the operational environment, cultural and ideological influences, and their stance on various issues.
Identifying Relationships and Misunderstandings: After filling out the matrix, identify areas of commonality, opposition, and potential misunderstandings between the stakeholders. This step helps to recognize opportunities for collaboration and areas of conflict that may need resolution.
Considerations for Effective Use#
Complex Interconnections: Recognize that real-world scenarios often involve more than two stakeholders. Multiple iterations of the tool might be necessary to cover all relevant parties.
Contextual Analysis: Ensure that the analysis includes a comprehensive view of the stakeholders’ relationships, including their perceptions of the operational environment and legitimate actions.
Values and Beliefs: Acknowledge that each stakeholder has their own set of values, beliefs, and rational perspectives, which influence their decisions and actions.
The “Four Ways of Seeing” offers a structured approach to understanding complex stakeholder dynamics in diverse scenarios. By systematically examining how different entities perceive each other and their environment, this tool aids in crafting more informed and effective strategies in complex situations.
Chronologies and Timelines#
Chronologies and Timelines are pivotal tools in structured analytics, allowing analysts to map out events, trends, and developments over time. These tools provide a clear and organized way to visualize the sequence and duration of events, aiding in understanding complex histories and forecasting future trends.

The Power of Sequencing#
Historical Context: Timelines offer a linear representation of events, which is essential for understanding the historical context of any issue. They illustrate how past events have progressed and interlinked to shape the current situation.
Identifying Patterns: By laying out events in a chronological order, analysts can more easily spot patterns, anomalies, and recurring themes. This can be particularly useful in fields like market analysis, political studies, and social research.
Cause and Effect: Chronologies help in identifying cause-and-effect relationships. Understanding the temporal sequence of events can highlight how certain actions led to specific outcomes.
Predictive Analysis: Timelines are not just about the past; they also aid in forecasting. By analyzing the trajectory of past events, analysts can make educated guesses about future trends and prepare for potential scenarios.
Building Effective Timelines#
Select Relevant Data: Determine what events, milestones, or data points are most relevant to the analysis. Overloading a timeline with too much information can obscure important insights.
Consider Different Scales: Timelines can be created for various durations – from days to decades. The scale should be chosen based on the scope of the analysis and the level of detail required.
Use Visual Aids: Employing visual elements like color coding, icons, or varying line weights can help in differentiating between types of events or highlighting key moments.
Dynamic Timelines: In the digital age, timelines can be interactive and dynamic, allowing users to explore different layers of information and view events from various perspectives.
Chronologies and Timelines are more than just a record of events; they are a lens through which we can view the past, understand the present, and anticipate the future. In structured analytics, these tools are indispensable for bringing clarity to complex data sets and illuminating the path ahead.
Sorting, Ranking, Scoring and Prioritizing#
Sorting, ranking, scoring, and prioritizing are integral techniques in structured analytics, each playing a unique role in transforming raw data into actionable intelligence. These methods help analysts to organize, evaluate, and interpret data more effectively, leading to informed decision-making.

Sorting: Sorting is the process of arranging data in a specific order or sequence. This could be chronological, alphabetical, or numerical, depending on the data type and analysis objective. Sorting provides a structured view of data, making it easier to identify patterns or anomalies.
Ranking: Ranking involves assigning a relative position or level to items within a dataset based on specific criteria. Unlike sorting, which organizes data, ranking explicitly compares data points to each other, establishing a hierarchy or order of importance or relevance.
Scoring: Scoring assigns quantitative values to data based on predefined metrics or criteria. This technique is essential in quantifying qualitative data, facilitating comparison across different data sets. Scoring is often used in risk assessment, customer segmentation, and performance evaluation.
Prioritizing: Prioritization goes beyond ranking and scoring by adding an element of strategic decision-making. It involves determining the order of importance or urgency among various tasks or data points. This technique is crucial in resource allocation, project management, and strategic planning.
Implementation and Tools#
Algorithmic Approach: Many of these techniques can be implemented through algorithms, especially when dealing with large or complex datasets. Algorithms ensure consistency, accuracy, and efficiency in processing data.
Visualization: Visual tools like charts, graphs, and heat maps often accompany these techniques to provide a more intuitive understanding of the sorted, ranked, scored, or prioritized data.
Matrices#
Matrices are a vital tool in structured analytics, providing a framework for multi-dimensional analysis. By arranging data in rows and columns, matrices allow analysts to examine relationships, compare variables, and identify patterns across different dimensions. Here’s how matrices enhance analytical capabilities:

Facilitating Comparison: Matrices enable the side-by-side comparison of different data sets or variables. This visual arrangement makes it easier to discern relationships and contrasts, which is essential in comparative studies or when assessing multiple options.
Multifaceted Analysis: By organizing data into a grid format, matrices allow for the simultaneous examination of several factors. This multidimensional perspective is key in complex analyses where multiple variables interact.
Identifying Correlations: Matrices are particularly useful in spotting correlations and dependencies between variables. Analysts can quickly see how changes in one variable might correlate with changes in another.
Decision-Making Support: Decision matrices are a specific application where options are evaluated against various criteria. This methodical approach aids in making informed, objective decisions based on multiple factors.
Types of Matrices#
SWOT Analysis Matrix: Strengths, Weaknesses, Opportunities, and Threats are laid out in a matrix to evaluate strategic positions.
Risk Assessment Matrix: This matrix assesses the likelihood and impact of risks, aiding in prioritization and mitigation strategies.
Priority Matrix: Used for time management and project planning, helping to categorize tasks based on urgency and importance.
In structured analytics, matrices are more than just data tables; they are a strategic tool for multidimensional analysis. Whether it’s for comparing options, assessing risks, or identifying correlations, matrices provide a structured and clear way to analyze complex data sets, making them indispensable in analytical decision-making.
Mind Maps#
Mind maps are a powerful visual tool in structured analytics, used for brainstorming, organizing information, and exploring complex ideas. They offer a unique way to visually structure thoughts, making connections between various concepts more apparent. Here’s an overview of how mind maps enhance analytical processes:

Idea Generation: Mind maps facilitate brainstorming by encouraging the free flow of ideas. They allow analysts to quickly capture and connect thoughts, leading to a more creative and expansive thinking process.
Organizing Information: With their radial structure, mind maps organize information hierarchically. Central ideas branch out into related subtopics, making it easy to structure and categorize data.
Visualizing Relationships: Mind maps excel at displaying the relationships between different pieces of information. This visual representation helps in understanding how various ideas or data points are interconnected.
Simplifying Complex Concepts: By breaking down complex topics into smaller, interconnected parts, mind maps can simplify intricate concepts, making them more digestible and easier to analyze.
Enhancing Memory and Recall: The visual and organized nature of mind maps aids in better memory retention and recall of information, which is beneficial in long-term analytical projects.
Creating Effective Mind Maps#
Start with a Central Idea: Begin by placing the main concept or problem at the center of the map. This central idea acts as the starting point for branching out into related topics.
Use Keywords and Symbols: Represent ideas with keywords, symbols, or images. This concise representation makes the map easier to read and understand.
Employ Color Coding: Using different colors for branches or themes can enhance the visual appeal of the map and aid in distinguishing between various elements.
Flexible Structure: While traditional mind maps have a radial structure, feel free to adapt the layout to fit the specific needs of your analysis. The key is to maintain clarity and logical connections.
Mind maps are versatile and can be applied in various stages of the analytical process, from initial data gathering and idea generation to the final presentation of findings. They are particularly useful in collaborative settings, where the visual format facilitates group discussion and collective brainstorming.
Generate Ideas#
In the realm of structured analytics, the generation of ideas stands as a cornerstone of innovative problem-solving and strategic thinking. This chapter delves into the dynamic process of idea generation, a critical phase where creativity intersects with analytical rigor. We will explore various methodologies and tools designed to stimulate the analytical mind, fostering a rich environment where novel ideas can flourish. From traditional brainstorming techniques to modern ideation frameworks, this chapter aims to equip analysts with the skills to not only generate a multitude of ideas but also to refine and harness them effectively. By embracing diverse perspectives and challenging conventional thought processes, we will uncover how structured analytics can be a powerful catalyst for generating transformative and actionable insights.
Structured Brainstorming#
Structured Brainstorming is a crucial technique in cybersecurity, offering a systematic approach to generating innovative solutions for complex cyber challenges. This method combines the free-flowing nature of traditional brainstorming with a structured framework, ensuring that the process is both creative and focused. Here’s how structured brainstorming can be effectively implemented in the field of cybersecurity:

Defining the Problem: Start with a clear and concise definition of the cybersecurity challenge at hand. A well-defined problem sets the stage for targeted and relevant idea generation.
Gathering a Diverse Team: Assemble a team with diverse backgrounds and expertise. Different perspectives are invaluable in cybersecurity, where threats and solutions can be multi-faceted.
Setting Rules and Objectives: Establish ground rules for the brainstorming session, such as withholding criticism and encouraging wild ideas. Define what the session aims to achieve, whether it’s generating new security strategies, solving a specific problem, or improving existing protocols.
Idea Generation: Encourage participants to freely express their thoughts and ideas, no matter how unconventional. Use techniques like mind mapping, lateral thinking, or the SCAMPER method (Substitute, Combine, Adapt, Modify, Put to another use, Eliminate, Reverse) to stimulate creative thinking.
Organizing and Refining Ideas: After the initial brainstorming, organize the ideas based on themes or categories. This is where the structured element comes into play. Evaluate the ideas against predefined criteria like feasibility, impact, and resource requirements.
Action Plan Development: Select the most promising ideas and develop them into actionable plans. This may involve further research, developing prototypes, or creating a detailed implementation strategy.
Structured brainstorming is a powerful tool in the cybersecurity toolkit. It merges creativity with analytical rigor, leading to the development of robust, innovative solutions. By systematically harnessing the collective brainpower of a team, cybersecurity professionals can stay ahead in a field where novel approaches and agile thinking are key to success.
Starbursting#
Starbursting is a structured brainstorming technique widely used in analytics to systematically explore a topic or problem by generating questions. This method encourages an exhaustive examination of all aspects of an issue, ensuring a thorough and comprehensive analysis. Here’s how starbursting can be effectively utilized, particularly in the context of cybersecurity:
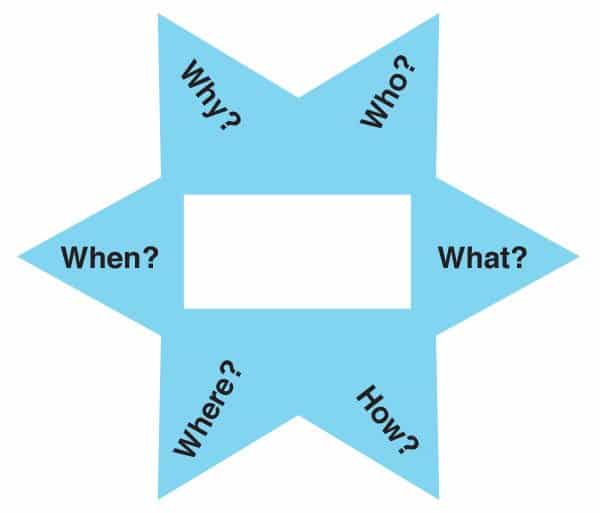
Formulating the Starbursting Diagram: At the center of the starbursting diagram is the topic or issue at hand. Radiating outwards are the ‘spokes’ of the star, each representing a question related to the central topic. These questions typically begin with the words who, what, where, when, why, and how.
Generating Questions: The process involves brainstorming as many questions as possible for each category of the spokes. In cybersecurity, this could involve asking ‘What are the potential threats?’, ‘How could these threats penetrate our defenses?’, or ‘Why is a particular system vulnerable?’
Expanding Understanding: By systematically questioning every aspect of the problem, starbursting helps in uncovering areas that might otherwise be overlooked. It ensures a deep dive into the complexities and nuances of cybersecurity challenges.
Prioritizing and Answering Questions: Once a comprehensive set of questions is developed, the team can prioritize them based on their relevance and urgency. Answering these questions will guide further research, analysis, and strategy development.
Facilitating Collaborative Analysis: Starbursting is especially effective in group settings. It promotes diverse perspectives and collaborative problem-solving, crucial in addressing multifaceted cybersecurity issues.
Starbursting is a powerful tool in the arsenal of structured analytics techniques. In the constantly evolving field of cybersecurity, it provides a methodical approach to question-asking, leading to a deeper understanding and more effective strategies for cyber defense and risk management.
Hypothesis Generation and Testing#
In the intricate world of structured analytics, the process of hypothesis generation and testing stands as a pillar of sound reasoning and informed decision-making. This chapter delves into the art and science of formulating hypotheses and rigorously testing them within a structured analytical framework. Hypothesis generation and testing are not merely academic exercises; they are vital tools in fields such as cybersecurity, where they guide analysts through the labyrinth of data and assumptions to uncover hidden truths and validate theories. We will explore methods to construct well-defined hypotheses, techniques to objectively test them, and strategies to interpret the results. This approach is crucial for ensuring that our conclusions are not only based on data but also stand up to scrutiny, making our analyses robust, reliable, and ready to meet the complex challenges of the digital age.
Hypothesis Generation#
Hypothesis Generation is a critical first step in the analytical process, particularly in fields like cybersecurity. It involves formulating testable statements or assumptions that guide the direction of the subsequent analysis. This section outlines the key aspects of generating effective hypotheses in structured analytics:

Understanding the Problem: Begin by thoroughly understanding the issue at hand. In cybersecurity, this might involve comprehending the nature of a security breach, the characteristics of a cyber threat, or the vulnerabilities of a system.
Gathering Preliminary Information: Collect relevant data and information to inform your hypothesis. This might include historical data, patterns of past attacks, threat intelligence reports, or any anomalous activity noted in the system.
Asking the Right Questions: Formulate questions that address the core of the problem. Questions like ‘What might be the cause of the vulnerability?’ or ‘How could this type of attack occur?’ can lead to insightful hypotheses.
Formulating the Hypothesis: Based on your understanding and the questions raised, develop a clear, concise, and testable hypothesis. A well-structured hypothesis in cybersecurity should provide a possible explanation for a security event or suggest a potential threat pattern.
Considering Alternative Perspectives: Avoid confirmation bias by considering multiple hypotheses or alternative explanations. In cybersecurity, threats can often be multi-faceted, so it’s important to explore various angles.
Collaborative Hypothesis Generation: Engage with a team of diverse experts to generate a wider range of hypotheses. Collaborative sessions can bring in different perspectives and expertise, leading to more comprehensive hypotheses.
Characteristics of a Good Hypothesis#
Clarity and Conciseness: The hypothesis should be clearly stated and concise, avoiding ambiguity.
Testability: It should be possible to prove or disprove the hypothesis through analysis and evidence.
Relevance: The hypothesis must be directly related to the problem or issue being analyzed.
Hypothesis generation is more than just a preliminary step; it sets the stage for the entire analytical process. In cybersecurity, where the stakes are high and the data complex, a well-formulated hypothesis not only guides effective analysis but also ensures that efforts are focused and results are meaningful. This stage is crucial for laying a solid foundation for deeper investigation and for driving toward actionable insights.
Diagnostic Reasoning#
Analysis of Competing Hypotheses#
Analysis of Competing Hypotheses (ACH) is a systematic method used in structured analytics to evaluate multiple hypotheses by deliberately seeking evidence against them. This technique is particularly useful in fields like cybersecurity, where analysts often face complex scenarios with multiple possible explanations. Here’s how ACH can be effectively implemented:

Identify Potential Hypotheses: Start by listing all possible hypotheses that could explain the observed data or situation. In cybersecurity, this might involve different threat actors, methods of attack, or internal vulnerabilities.
Collect Evidence: Gather all available evidence related to the hypotheses. This includes both information that supports and contradicts each hypothesis. In the context of cybersecurity, evidence can range from system logs and network traffic data to user activity logs and external threat intelligence.
Create a Matrix: Organize the hypotheses and evidence in a matrix format. Each row represents a hypothesis, while each column represents a piece of evidence. This matrix helps in systematically analyzing the relationship between each hypothesis and the available evidence.
Evaluate the Hypotheses: For each piece of evidence, assess whether it is consistent, inconsistent, or not applicable to each hypothesis. This process helps in identifying which hypotheses are less likely based on the evidence.
Refine and Iterate: As new evidence emerges, revisit and update the matrix. This iterative process may lead to the elimination of some hypotheses and the refinement of others.
Conclude with the Most Likely Hypothesis: The hypothesis that best withstands the scrutiny against contradictory evidence and has the most supporting evidence is typically considered the most likely explanation.
Benefits in Cybersecurity#
Reduces Cognitive Biases: ACH helps counteract common analytical biases by focusing on disproving rather than confirming hypotheses.
Comprehensive Analysis: This method ensures a thorough examination of all potential explanations, leading to more accurate conclusions.
Enhances Decision-Making: By systematically evaluating competing hypotheses, cybersecurity professionals can make more informed decisions about threat mitigation and response strategies.
The Analysis of Competing Hypotheses is a powerful tool in the arsenal of structured analytic techniques. It provides a disciplined approach to evaluating multiple hypotheses, crucial in the complex and often ambiguous realm of cybersecurity. By rigorously testing various scenarios, ACH aids analysts in arriving at well-supported conclusions, enhancing the overall effectiveness and reliability of their analyses.
Argument Mapping#
Argument Mapping is a visual tool in structured analytics used to clarify and enhance critical thinking by mapping out the structure of reasoning and arguments. Particularly useful in complex fields like cybersecurity, it aids in understanding the logical flow and relationships between different statements and premises. Here’s how argument mapping can be effectively utilized:

Identifying Key Components: Begin by identifying the main components of the argument or reasoning, including claims, evidence, conclusions, and counterarguments. In cybersecurity, this might involve dissecting arguments about threat origins, security strategies, or system vulnerabilities.
Structural Layout: Lay out these components in a structured, visual format. This typically involves nodes (representing statements or claims) connected by lines that indicate relationships (support or contradiction).
Mapping Logical Connections: Clearly map how individual pieces of evidence support or counter specific claims or conclusions. This visual representation helps in assessing the strength and validity of the argument.
Evaluating the Argument: Use the map to critically evaluate the reasoning. Look for logical fallacies, weak links, or unsupported assumptions. In cybersecurity, this critical evaluation can help in assessing threat assessments or proposed security measures.
Facilitating Collaborative Analysis: Argument mapping is particularly effective in group settings. It makes complex reasoning more accessible and discussable, enabling collaborative examination and refinement of arguments.
Refining and Revising: As new information is gathered, or as understanding evolves, update and refine the argument map. This makes it a dynamic tool that evolves with the ongoing analysis.
Benefits in Cybersecurity#
Clarifies Complex Arguments: Helps in breaking down and understanding complex cybersecurity arguments or strategies.
Enhances Critical Thinking: Encourages rigorous analysis of each component of the argument, fostering deeper critical thinking.
Improves Decision-Making: Aids in making well-informed decisions by providing a clear and logical structure of the arguments.
Argument Mapping is a potent tool in structured analytics, providing a clear visual format for understanding and evaluating complex arguments and reasoning. In the realm of cybersecurity, where arguments can be intricate and the stakes high, argument mapping is invaluable for ensuring that decisions are based on solid, critically evaluated reasoning.
Assessment of Cause and Effect#
In the analytical journey, understanding the intricate web of cause and effect is fundamental to uncovering truths and forming sound conclusions. This chapter explores the critical process of assessing causal relationships across various scenarios encountered in structured analytics. We delve into techniques that distinguish mere correlations from genuine causality, shedding light on how events are interconnected. The emphasis is on rigorous, evidence-based analysis to identify the underlying causes of observed phenomena. Such insights are crucial for crafting effective solutions and strategies in diverse fields. Through practical examples and theoretical discussions, the chapter guides the reader in mastering the art of discerning cause and effect, a skill that enhances both analytical acumen and decision-making prowess.