Introduction to Linux binary exploitation - Part 1
Introduction to Linux binary exploitation - Part 1#
In order to begin the process of exploiting Linux binaries, we first need to become familiar with the target. We will need the appropriate instruments in order to accomplish it. Because gathering information is the most important aspect of any security research activity, including binary exploitation, it is very important to know how to use tools that will help us recognize what is happening inside the target binaries.
In contrast to Windows, where the majority of apps feature graphical user interfaces, Linux and the majority of Linux exploitation tools feature command line terminals.
Linux’s default debugger is gdb. It is preinstalled on the majority of Linux distributions and is available via:
sudo apt-get install gdb
To increase the visibility of gdb findings, there are a large number of plugins available on the web that were created by the community and made available to the public.
There are PEDA and pwndbg among them. In this article, PEDA will be utilized.
PEDA is easily downloadable and configurable. Its GitHub repository can be accessed at the following URL:
https://github.com/longld/peda
The installation instructions are simple and straightforward.
The /.gdbinit file provides startup commands to be executed by gdb. You can compare it to a .bashrc file for gdb.
Simply use the command:
gdb [file]
to debug a file with gdb. Note that debugging suid binaries or attaching to a more privileged process will not be permitted.
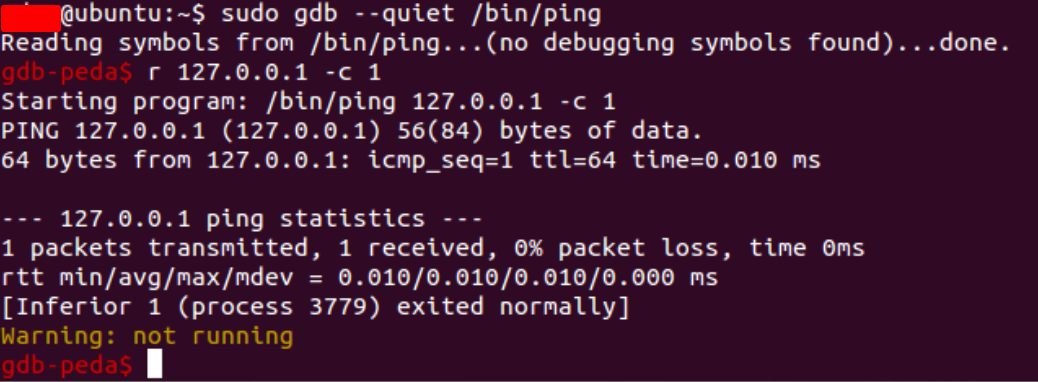
Once the program has been loaded into gdb, it can be executed using the run or r command.
You are also allowed to specify command line arguments after the run command:
Find some extra and handy gdb commands listed below:
disas [function name]- Displays a disassembly of the specified function.break [function]orbreak *0xaddress- Places a breakpoint at the entry of a specified function or address. When a breakpoint is hit, execution will stop.print [name]– Displays the contents of the specified object. The name may represent a function, register, or variable.info [name]- Displays information regarding the specified name; for instance, info registers prints the contents of all registers.step- Advance the program till the next source line is reached (Step Over).stepi- Follow precisely one instruction.x– inspect. This command displays numerous memory locations in a variety of formats. It has the syntaxx/[number of units][data type][location name].
For example, you can use:
x/20w $esi
which displays 20 words starting from where esi points to.
It is important to note that there are two variants of common user Assembly syntax: AT&T and Intel.
What about gdb? It’s employs the AT&T syntax by default, which implies assembly code is written differently. For instance, a percent sign must precede any register, else the operands are written in reverse order compared to the Intel syntax, which may cause confusion.
You can change the syntax handling manually by issuing the:
set disassembly-flavor intel
command. PEDA does this by default, as you can see in its source code below:
    def disassemble(self, *arg):
        """
        Wrapper for disassemble command
            - arg: args for disassemble command
        Returns:
            - text code (String)
        """
        code = ""
        modif = ""
        arg = list(arg)
        if len(arg) > 1:
            if "/" in arg[0]:
                modif = arg[0]
                arg = arg[1:]
        if len(arg) == 1 and to_int(arg[0]) != None:
            arg += [to_hex(to_int(arg[0]) + 32)]

        self.execute("set disassembly-flavor intel")
        out = self.execute_redirect("disassemble %s %s" % (modif, ",".join(arg)))
        if not out:
            return None
        else:
            code = out

        return code
Other important tools for analyzing Linux binaries include readelf, ltrace, strace, and objdump.
You might also utilize strings.
ltraceandstracetrace library or system calls made by a binary target.The
readelfcommand displays information regarding an ELF (Linux executable format) file.objdumpdisplays object file information. Additionally, it can be used to disassemble Linux executables.stringsextracts strings that are readable from a binary. This can be used to extract hardcoded paths, “hidden” strings, or names.
ELF (Executable and Linking Format) is the executable file format for Linux and unix.
The components of an ELF file are an ELF-header and ELF-data.
It can be investigated with the readelf command:
readelf -a /bin/ping
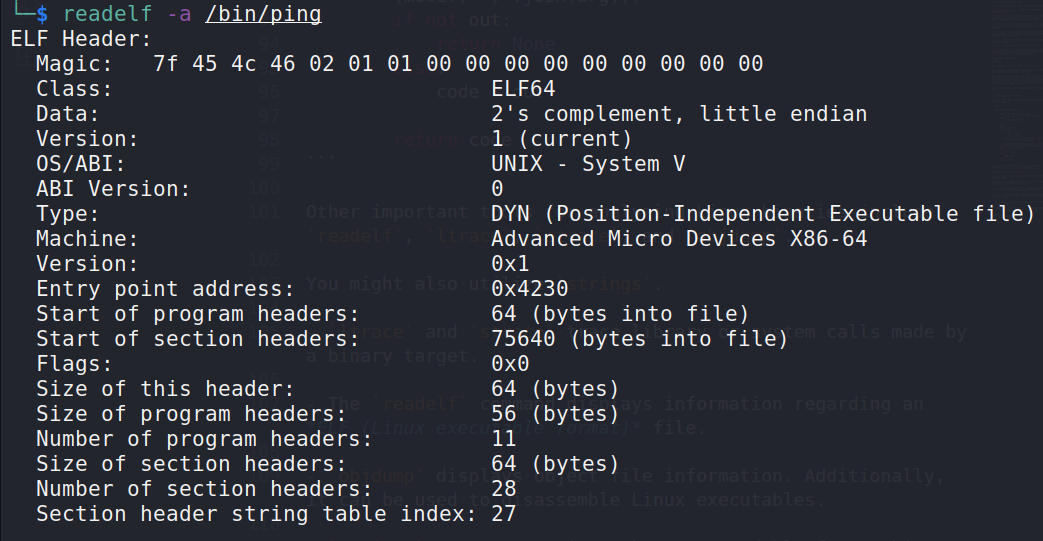
An ELF header contains crucial information for the operating system regarding how to process the file. Here are the most crucial elements of the header:
It begins with the hexadecimal sequence:
7f 45 4c 46Class specifies the architectural target
Data refers to the endianness type (little or big)
Type may be CORE (core dumps), DYN (shared objects), EXEC (executables), or REL (relocatable files).
Memory corruption is the cause of core dumps. They can be supplied to gdb to analyse crashed programs with greater precision. We will use core dumps later on during exploit development.
Before moving on to the last three types, it is necessary to define linkers and loaders.
Linkers are responsible for connecting the names of functions to their actual memory locations. During a call to a function, the linker is responsible for identifying the function’s memory address inside a system library and writing it to the executable’s process memory so that the function may be accessed at that address. A loader’s responsibility is to load programs from storage into memory.
If an executable requests to be loaded at an already occupied memory address, it must be moved. Relocation is the process of repositioning a module in memory to avoid address clashes.
ELF files contain a .reloc section as this should be done in an organized manner. Whenever the desired loading address is unavailable, it is the responsibility of the .reloc section to patch the program with new addresses.
Consequently, relative addressing is employed to describe the addresses of program functions.
Relative addressing identifies a function’s address by its offset from the loading base address, as opposed to its entire address.
For example, if the relative virtual address of a function is 0x123 and its program is loaded at 0x804000, the function can be found at 0x804123.
Additionally, executable files may contain symbols. Symbols describe the executable code and include function and variable names, among others. The developer of an executable may disable support for symbols during compilation.
Many function and variable names provide a hint as to what they are intended to achieve; for instance, locating functions titled getName() or printName() can eliminate a great deal of reverse engineering work.
The removal of symbols from an ELF file is known as stripping.
Now that some Linux executable handling ideas have been described, let’s define the three remaining ELF file formats:
EXEC (executables)
REL (relocatable files)
DYN (shared objects)
Executable files can be mapped directly into memory upon execution.
Files that are relocatable are executables that facilitate the relocation process.
In the event of an address collision, they employ relative addressing and modify the addresses of their components with a constant offset to their dynamic base address.
Shared Objects are function libraries. They comprise parts typical of both executable and relocatable files from a technological standpoint. They are frequently identifiable by their .so extension.
During program launch, shared objects are loaded into a program that will use them.
Sections are common locations within an ELF file that contribute to its functionality. Sections are mapped into the process memory during startup. Mapping involves placing them in the memory of a newly generated process based on their size and the information they contain.
Theoretically, none or all of the section’s permissions - read, write, and execute - can be enabled.
See also
Looking to expand your knowledge of vulnerability research and exploitation? Check out our online course, MVRE - Certified Vulnerability Researcher and Exploitation Specialist In this course, you’ll learn about the different aspects of software exploitation and how to put them into practice.